Valentina D’Efilippo is an independent data designer and creative director. Her work has won many recognitions and has been exhibited internationally.
Her critically acclaimed book, “The Infographic History of the World”, co-authored with data journalist James Ball, has been translated into eleven languages. Valentina is also the co-author and illustrator of the groundbreaking “Britannica’s Encyclopedia Infographica”, an awe-inspiring encyclopedia for kids featuring thousands of facts and hundreds of original infographics covering a vast range of topics – from space to planet Earth, the animal kingdom and the human body.
Valentina’s unique blend of creativity, storytelling, and data-driven insights has led her to collaborate with public organizations, start-ups, agencies, and global brands across a wide range of fields and formats. Her work spans theater productions, exhibitions, editorial content, and interactive platforms, establishing her as a leading voice in the field of data visualization and information design.
Valentina’s passion for sharing knowledge has also led her to coach corporate teams and teach at universities around the world. She has lectured at Columbia Business School and runs a popular Guardian Masterclass in Data Visualization.
1. What design trends do you think will take off this year and more in the future?
In the realm of data design, what excites me the most are the many possibilities to connect our audience to the stories behind the data – across any field and format. This involves giving voice to numbers through meaningful human experiences, whether those are digital interfaces, theater performances or business intelligence tools. These are just some of the many paths we can see for the present and for the future designing with data. The integration of technology into design, such as smart home features, and the creation of experiences that provide immediate insights into data (e.g., energy consumption, diet, fitness) are likely to persist and I am very excited about those possibilities. Also, as science and technology are pushing new boundaries, new data is becoming available, and new ways of making sense of those insights are needed. Right now, I am working on a BI tool regarding asteroids – which is fascinating.
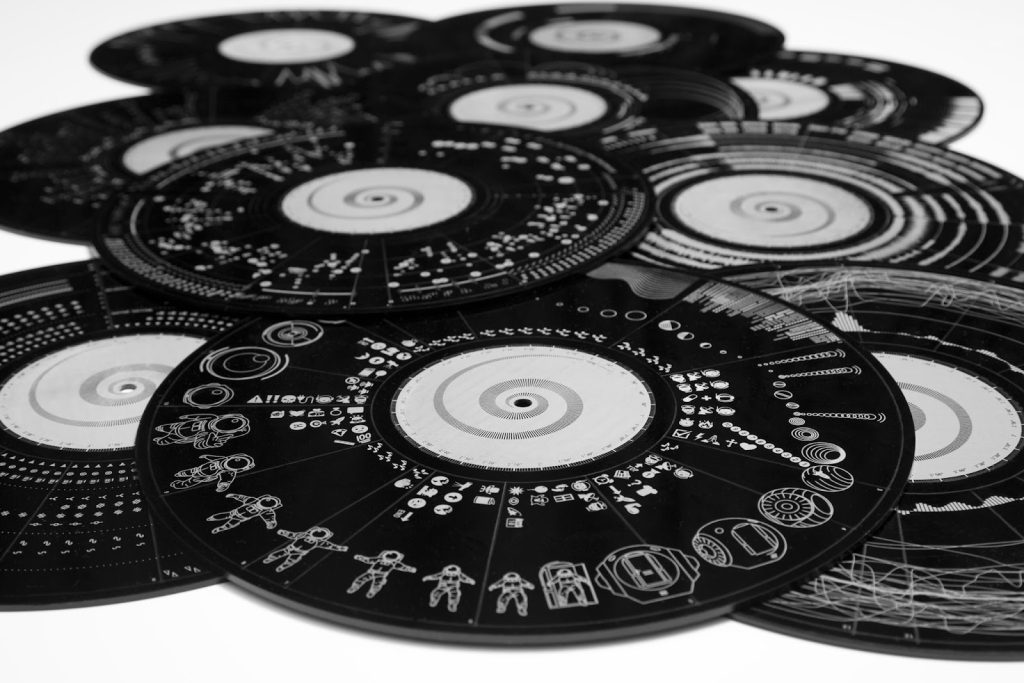
Also data design is by definition a visual discipline, but I see that continuing to expand and explore new ways of communicating data that are not only visuals – data sonification and data physicalization. I am a strong believer that rendering the data visually is just one of the many paths we can walk, but where possible we should explore more inclusive ways that allow all our senses to be engaged.
Over the past decade, the increasing need for communicating insights has driven the creation of more accessible dataviz tools democratizing the process and expanding access to data visualization. I anticipate this trend to continue, which is a great thing but it also raises concerns about discerning truth from distortion as more individuals access design tools and create data-driven outputs.
AI-based tools are already significantly influencing the design industry, and I believe that AI can potentially relieve designers of tasks like pixel pushing or data cleaning, allowing us to focus on what we do best: connecting our minds and hearts with the challenges at hand to problem solve.
Finally sustainable design trends will continue to gain popularity due to the increased awareness of global warming. Minimalist and functional designs I think will be embraced across sectors and industries, including digital design where there is potential to make outputs more eco-friendly.
2. When it comes to making design and the design industry more diverse, equal, and inclusive, what changes are needed or would you like to see?
I believe it’s crucial to prioritize diversity and inclusion in the design industry by actively seeking and amplifying underrepresented voices, providing equal opportunities for education and career advancement, and promoting diverse representation in leadership and decision-making roles.
In my experience, the lack of female role models in design leadership positions can be attributed to societal and parental norms, often leading women to sacrifice their careers to care for their children. Addressing these societal and structural challenges is essential for creating a more diverse and inclusive workplace across all industries – not just design.

3. What are 3 things you were not taught in school (if you were formally trained in design) that you wished you had been taught?
When I was studying industrial design and engineering, I wish I had known about the exciting field of data visualization and the many ways you can find your own focus as a designer. Academic programs often lag behind industry demands, and I hope for better alignment between academic offerings and industry needs in the future.
Alongside technical skills, I believe that communication skills are vital for designers. Being able to effectively present and promote our work is just as important as creating it.
Understanding how to receive and incorporate feedback, as well as managing attachment to ideas, is a valuable skill in the design world, where collaboration and adaptation are key.
Lastly, while not everyone ends up running a business, some basic business and finance skills, like understanding P&L, could benefit designers who venture into entrepreneurship or managerial roles.
4. What are the biggest challenges you’ve had to face as a designer? Did you overcome them? How?
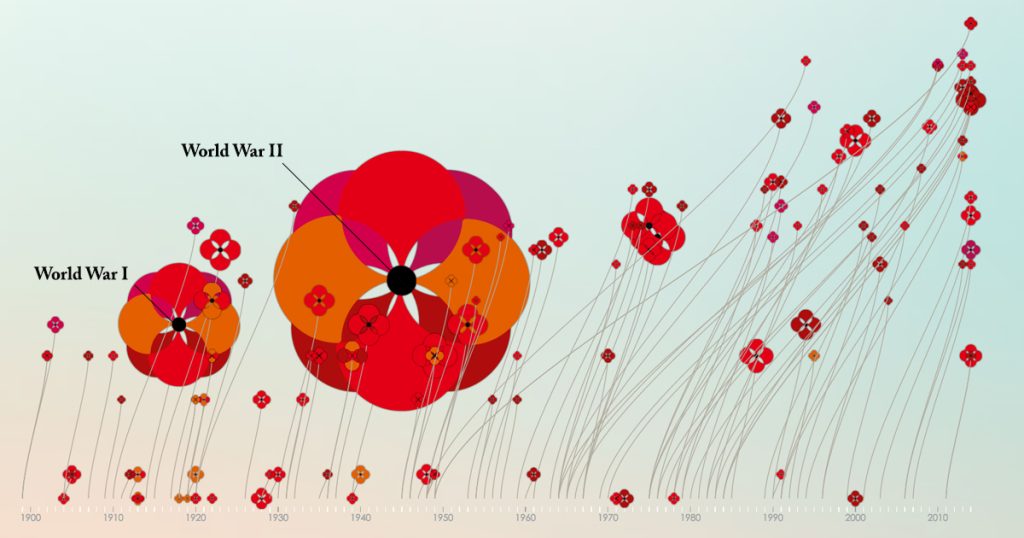
One of the significant challenges I faced working with data was not having a background in coding or technology (in fact, my process and approach is quite low-fi). Whether it was scraping an API, analyzing data, or presenting it interactively, I often felt limited by my non-technical background as a designer. However, I eventually realized that the process of transforming raw data into compelling experiences involves multiple disciplines, and the key to success lies in collaboration with others. This realization has helped me overcome this challenge by embracing teamwork and leveraging the expertise of individuals with diverse skill sets.
5. Why do you think Design Matters?
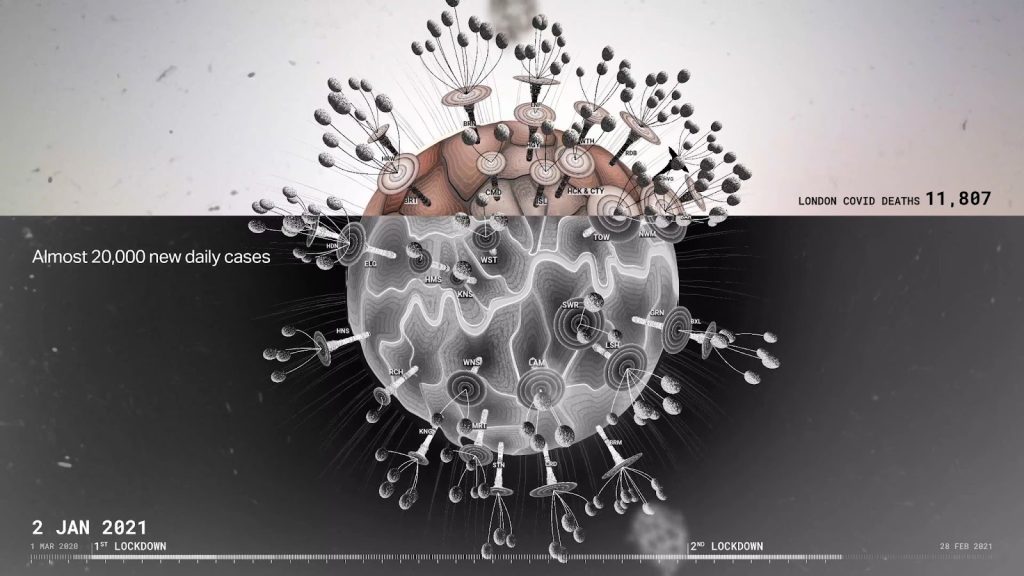
Design matters because it directly impacts the way we perceive and navigate our world, whether through products, services, books, communications, or advertisements. In the specific context of information design, it has the power to give voice to facts and figures so that people can use data, make sense of the insights, and understand the implications. Designing with data, in my view, means fostering knowledge and creating opportunities for understanding, connectivity, compassion, and action. This will be the theme of my talk at Design Matters in Mexico. I look forward to seeing you there!
Do you want to hear more from Valentina? She will give a talk at the digital design conference Design Matters Mexico 24, which will take place in Mexico City & Online, on Jan 31- Feb 1, 2024. Get your ticket here! Connect with D’Efilippo on LinkedIn
Don’t miss the chance to check out Valentina’s new book Britannica’s Encyclopedia Infographica, available at your favorite bookstore or on Amazon
LinkedIn, Instagram, Twitter and visit Her site.


